
The must-know stats from the 2018 Yellow Social Media Report
The Yellow Social Media report is an annual survey of 800 consumers, 1,000 SMBs and 100 large businesses on how they use social networking sites such as Facebook, LinkedIn and Twitter.
Check out the key stats from the 2018 Yellow Social Media Report.
For all the facts and figures download the full Yellow Social Media Report for 2018
June 2018
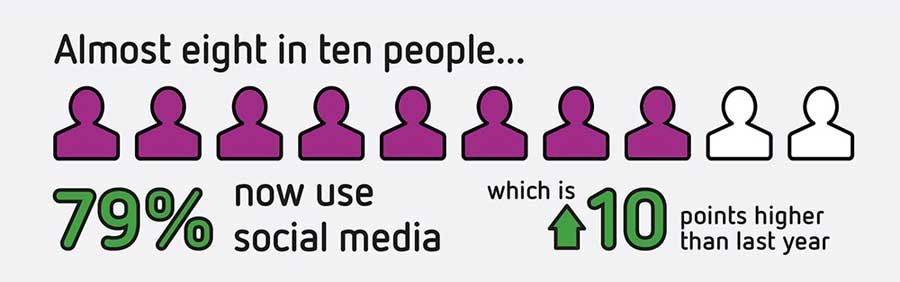
Number of Australians on social media
- Almost eight in 10 people (79%) now use social media, which is 10 points higher than last year.
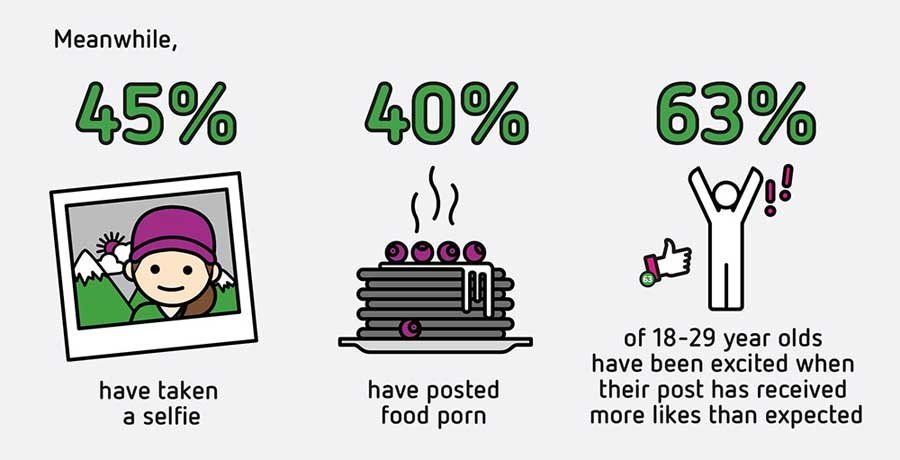
What people are doing on social media
- 45% have taken a selfie and this is more common among males (47% vs 43%) and 18-29 year olds (88%).
- Four in 10 have posted a photo of their food on social media and this is more common among males (43% vs 38%) and 18-29 year olds (82%).
- One in 3 people have felt excited when their post has received more likes on social media than usual. The number doubles among 18-29 year olds where six in 10 (63%) have felt this way.
The impact of social media
- 15% have felt anxious when unable to access their social media accounts and this number is significantly higher among 18-29 year olds (37%).
- Almost 2 in 10 (19%) are happy to check social media while eating with family or friends, with 30-39 year olds the biggest culprits (33%).
- 11% have worried their social media footprint might one day come back to bite them, with 30-39 year olds the most likely to feel this way (15%).
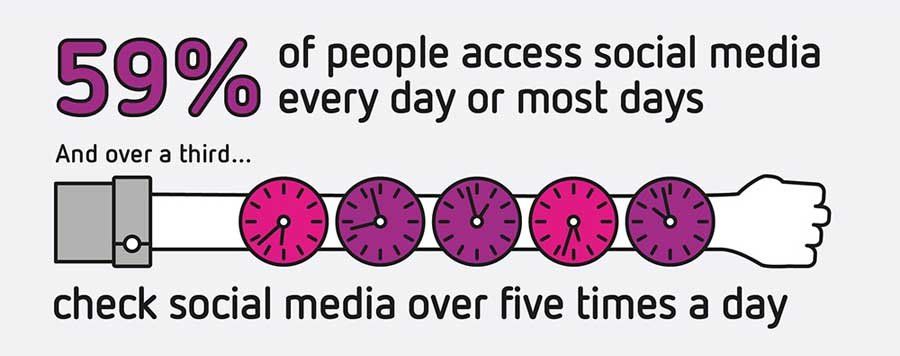
Frequency of use
- More than a third of people now access social media more than five times per day (35%), which is up from 26% last year. Among 18-29 year olds 89% check-in at least once per day.
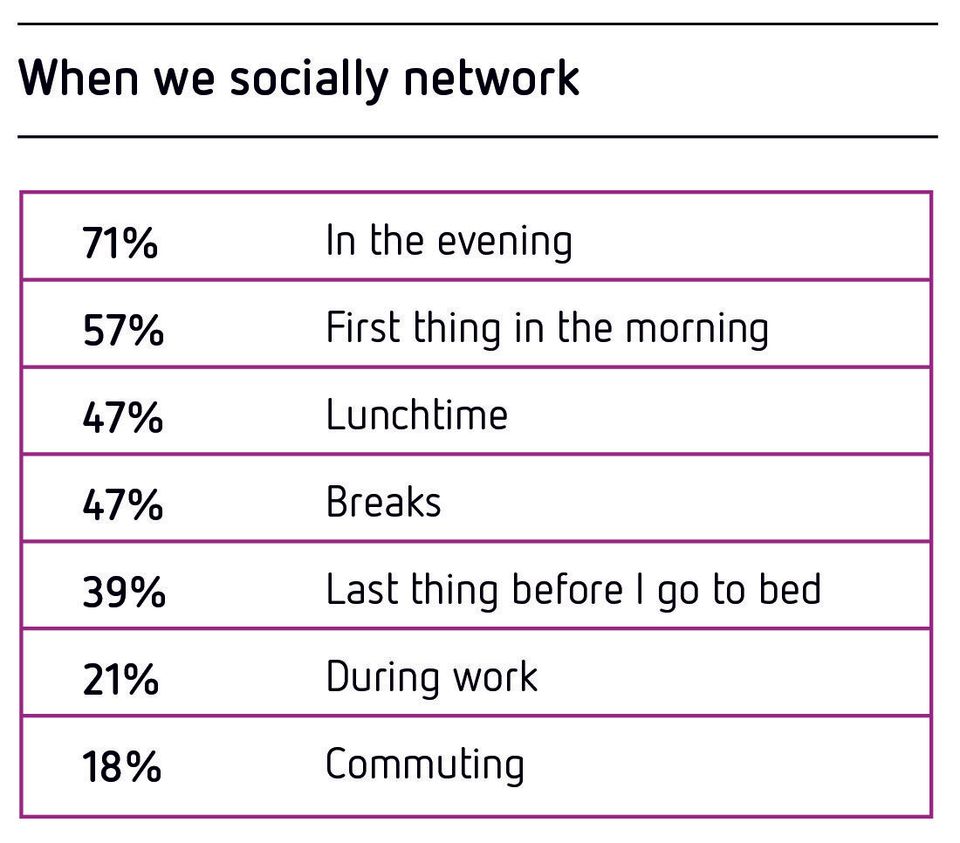
Most popular times
- In the evening (up from 49% to 57%) and first thing in the morning (up from 49% to 57%) have become even more popular and are the most popular times for using social media.
- Almost half are now accessing social media on their break (up from 33% to 47%) or at lunchtime (up from 36% to 47%).
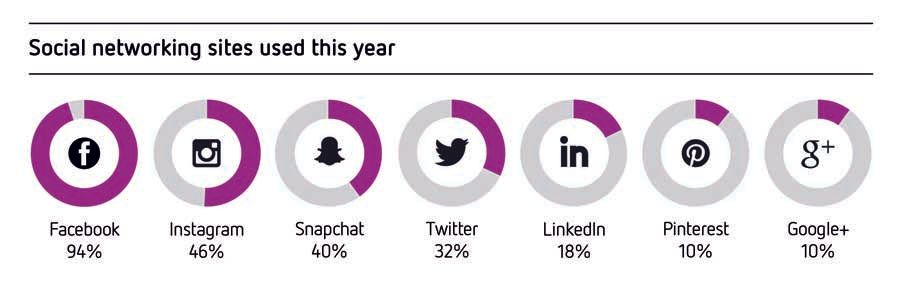
The most popular platforms
- Visual platforms continue to grow in popularity, with Instagram seeing a 15 point jump in users (from 31% to 46%). Snapchat saw the biggest growth, with usage almost doubling from 22% to 40% this year. Twitter has also seen a surge in usage, up from 19% to 32%.
- However, Facebook remains the most popular, with 94% of social media users on the platform.
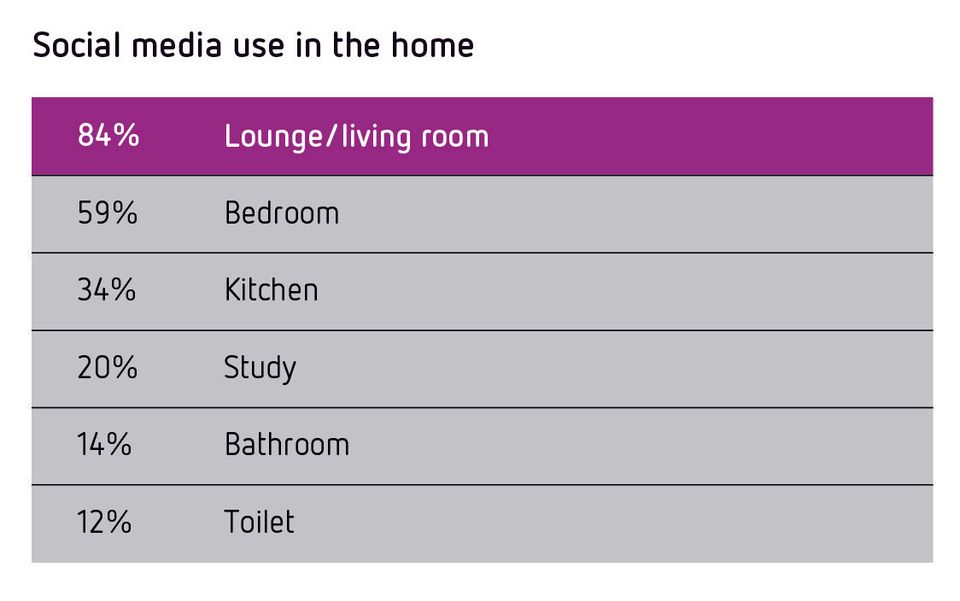
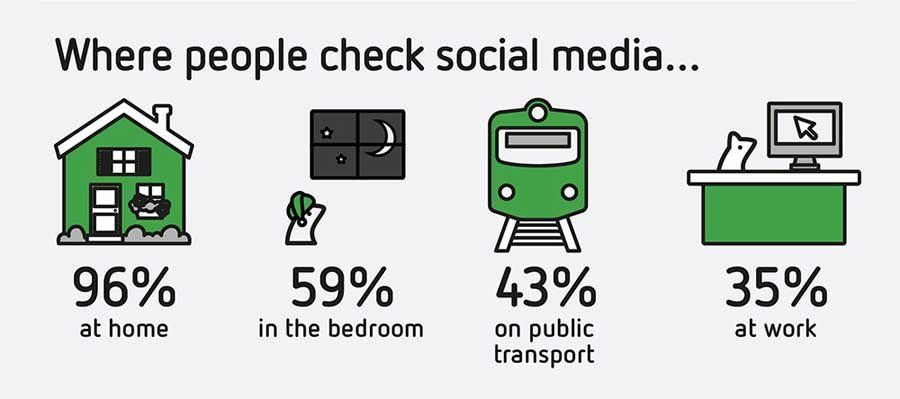
Where people are using social media
- The most popular place to use social media continues to be in the home (96%), with the lounge room (up from 69% to 84%), bedroom (up from 42% to 59%) and kitchen (up from 22% to 34%) increasing in popularity.
- Outside of the home usage on public transport (up from 25% to 43%), in restaurants, bars and parties (up from 19% to 33%) and in the car (up from 20% to 37%) has become more common.
- More than a third (35%) are accessing social media at work.
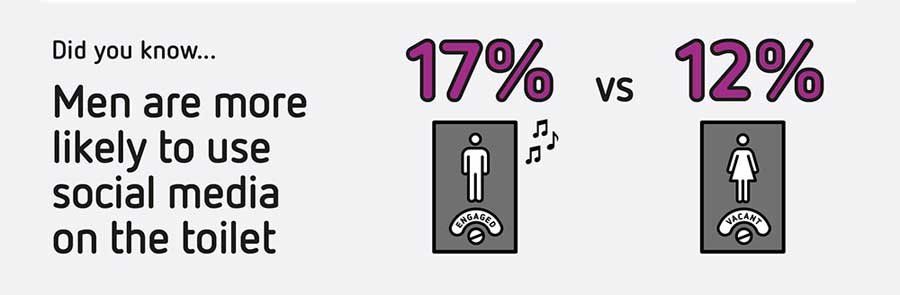
How do men and women compare on social?
- On average males have more friends than females on social media (522 vs 418).
- Males are more likely to use social media in most places such as at work (38% vs 32%) or on public transport (47% vs 39%). Inside the home they are more likely to use social media on the toilet (17% vs 12%) and in the bedroom (64% vs 54%).
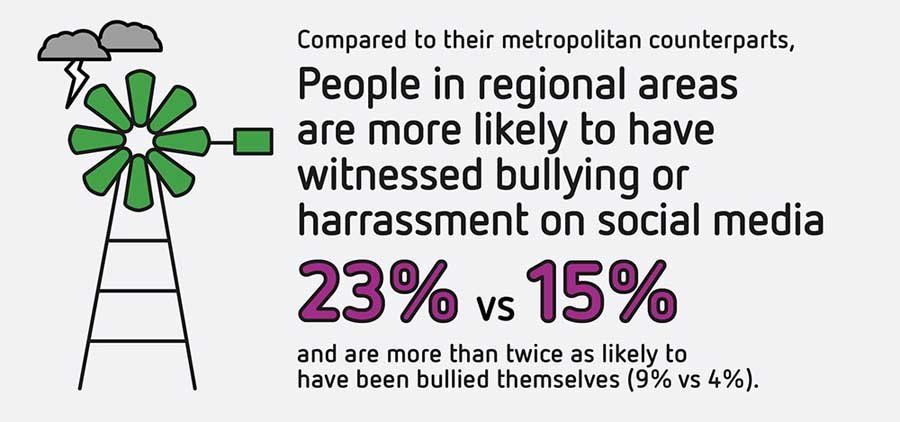
Metro vs Regional
- People in regional areas are more likely to have witnessed bullying or harassment on social media (23% vs 15%) and are more than twice as likely to have been bullied themselves (9% vs 4%).
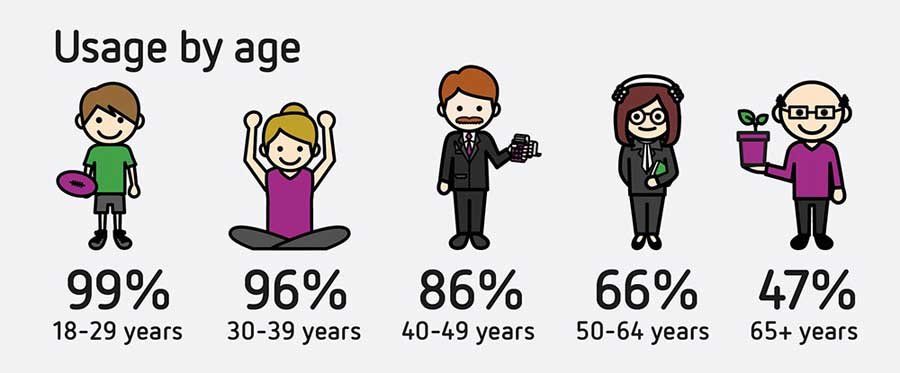
How the different age groups compare
- Among 18-29 year olds social media is often the first and last thing they do every day, with eight in 10 (79%) accessing social media first thing in the morning and almost two thirds (65%) last thing before they go to bed.
- Pretty much everyone aged 18-29 is on social media (99%), while less than half of those aged 65+ are on social media (47%).
Consumer preferences
- Almost a quarter (24%) of people use social media to follow brands or businesses, and this is even higher among females (27% vs 21%) and those aged 30-39 (41%).
- Consumers are particularly keen on discounts (54%) and give-aways (48%) from the brands or businesses they follow.
- Consumers are increasingly accessing social media on their smartphone (up from 72% to 81%).
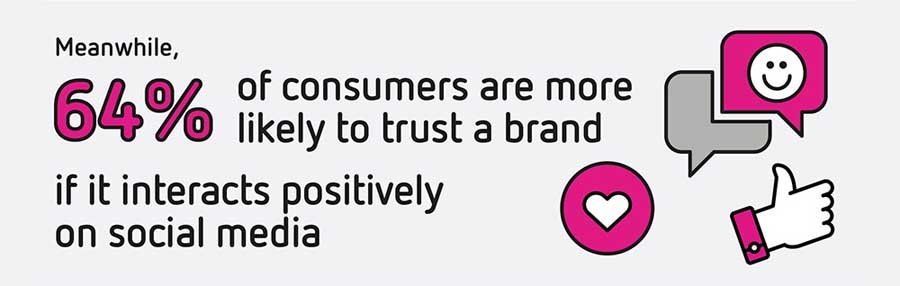
What makes consumers trust a brand
- Almost two thirds of consumers (64%) will be more likely to trust a brand if they interact with consumers in a positive way on social media. This is up 12 points this year.
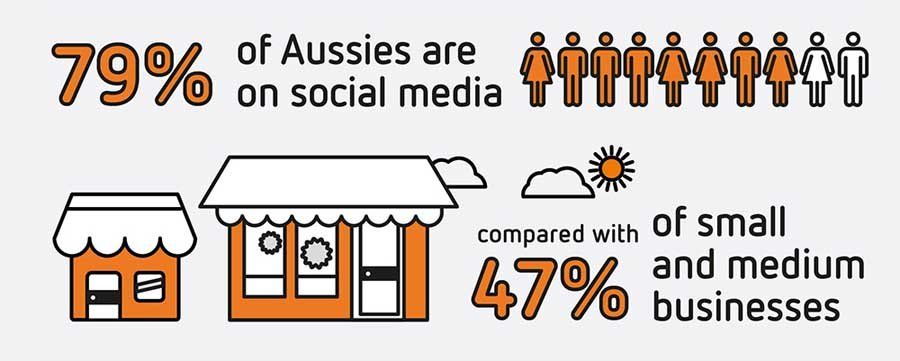
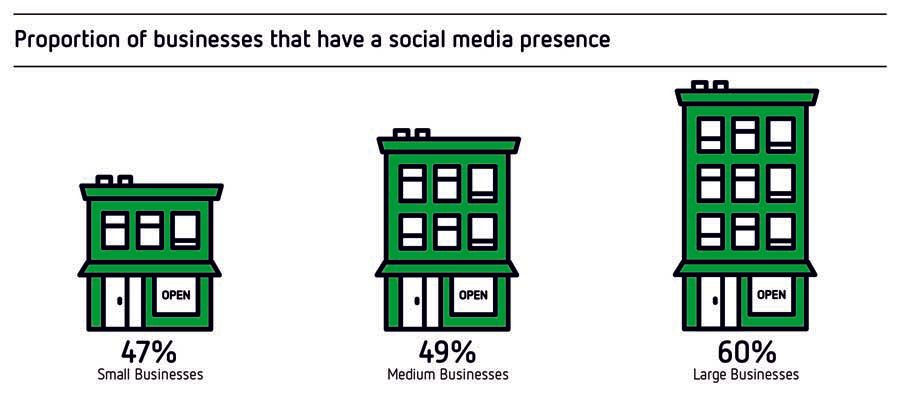
Businesses with a social media presence
- 47% of SMBs are now on social media, which is similar to last year (48%). This compares to 79% of consumers.
- For small businesses, the number has dropped 1 point to 47%.
- For medium businesses, the number has dropped 5 points to 49%.
- For large businesses, the number has dropped 19 points to 60%.
Platforms businesses are using
- Of those businesses with a social presence, Facebook is the most popular, used by around 9 in 10 of every size business.
- LinkedIn is the second most popular platform, used by a majority of large businesses (82%), 41% of medium size businesses and 35% of small businesses.
- Twitter increases in popularity with business size, from 24% of small businesses to 36% of medium size businesses and 55% of large businesses.
- Instagram is more prevalent in medium (39%) than small (19%) or large (20%) businesses.
Use of incentives and discounts
- The majority of businesses remain unlikely to offer incentives such as discounts and coupons via social media (29% small, 25% medium, 17% large), even though they have appeal to consumers.
- Among businesses offering incentives, discounts are the most common offer from small businesses (84%), while it is give-aways for medium size businesses (70%) and discounts for large businesses (80%).
Social media strategy
- An increasing number of businesses have a social media strategy. Large businesses lead the way, with 90% now having a strategy (up from 76%).
- SMBs lag behind but there has been an improvement this year, up from 31% to 40% among small businesses and from 36% to 43% for medium businesses.
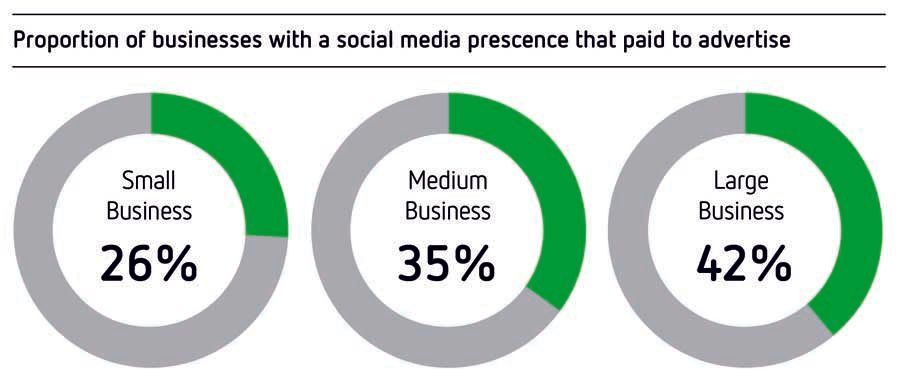
Advertising on social media
- Advertising on social media has become more popular among small (up from 20% to 26%) and medium (up from 27% to 35%) size businesses this year, although large businesses still lead the way (42%).
- For those businesses that advertise on social Facebook remains easily the most preferred channel (90% small, 62% medium, 100% large). LinkedIn (20%) and Twitter (24%) are also common among large businesses, while the same is true for Instagram (23%) among medium size businesses.
To download part one of the 2018 Yellow Social Media Report, click here.
The social media generation has come of age
...let's see what the Social Media Report has to say about its growing social impact.